Sustainable Enterprise Software The what, the why, and the how to design and implement Darryl Cauldwell
My name is Darryl Cauldwell and for the last thirty years I have focussed on creating hosting platforms for the development and delivery of enterprise software. Software engineering, the software development lifecycle and hosting platforms are designed and built against constraints. Sustainability has traditionally not been a constraint used in the design of enterprise software…. It should be. In this talk I'll aim to highlight some sustainability constraints and provide actionable advise for approaching these.
The Challenge Today's enterprise IT systems require significant data centre workload Demand for workload is increasing Governments and enterprises have committed to the 2030 Agenda for Sustainable Development Renewables are cleaner but less predictable energy supplies
Today's enterprise IT systems requires a lot of data centre workload. As enterprises continue with digital transformation programs the demand for data centre workload is increasing. At the same as increasing demand both governments and enterprises have made commitments to transform to meet goals of the '2030 Agenda for Sustainable Development'. As governments modernise their energy grid with increased use of renewable and reduced use of fossil fuels consistent supply forecasting becomes more complex and leads to less reliable energy supply.
2030 Agenda - Sustainable Development Goals UN General Assembly resolution (2015) — 17 Goals & 169 Targets
People
Planet
Prosperity
The 2030 Agenda for Sustainable Development is a resolution adopted by the UN General Assembly in 2015. At its heart are 17 Sustainable Development Goals (SDGs) and 169 targets. They recognise that ending poverty and other deprivations must go hand-in-hand with strategies that improve health and education, reduce inequality, and spur economic growth – all while tackling climate change and working to preserve our oceans and forests.
Enterprise Software SDG Alignment Target 6.4
Target 7.2
Target 9.4
Target 12.2
Target 12.5
Target 13.2
Each sustainable development goal has specific measurable targets and indicators. Typically the software development lifecycle and hosting of enterprise software can directly affect targets within these five goals. Specifically targets: 6.4 increase freshwater water-use efficiency, 7.2 increase the share of renewable energy in the global energy mix, 9.4 upgrade and retrofit infrastructure to make them sustainable, 12.2 sustainable management and efficient use of natural resources, 12.5 substantially reduce waste generation through prevention.
GreenHouse Gas (GHG) Protocol CO₂ CH₄ N₂O HFCs PFCs SF₆ NF₃
SCOPE 3
Supply chain emissions
📦 Purchased goods & services
🏭 Capital goods
⛽ Fuel & energy related
🚚 Transportation & distribution
♻ Waste generated
✈ Business travel
🚶 Employee commuting
◀ Upstream activities
REPORTING COMPANY
SCOPE 1
Emissions you directly produce
🏢 Company facilities
🚗 Company vehicles
SCOPE 2
Emissions from energy you purchase
⚡ Purchased electricity
♨ Steam, heating & cooling
SCOPE 3
Emissions after products
🚚 Transportation & distribution
⚙ Processing of sold products
💻 Use of sold products
🗑 End-of-life treatment
🏠 Leased assets
📊 Franchises & investments
Downstream activities ▶
GHG Protocol establishes comprehensive global standardised frameworks to measure and manage greenhouse gas (GHG) emissions from private and public sector operations, value chains and mitigation actions. Scope 1 covers direct GHG emissions, an example would be burning fuel in company vehicles. Scope 2 covers energy specific indirect GHG emissions, an example would be the consumption of electricity for running business software. Scope 3 covers most indirect GHG emissions, an example, buying, using and disposing of products and services from suppliers.
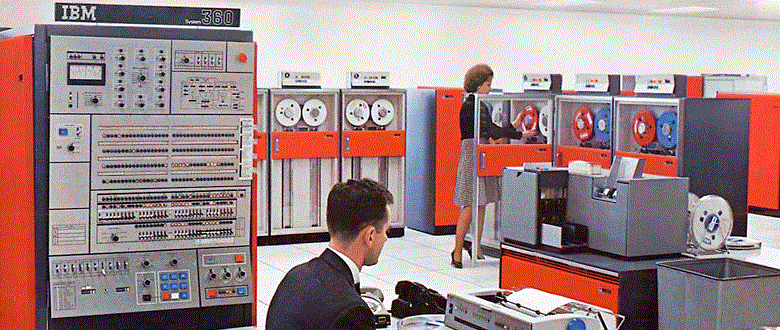
Mainframe: Birth of the Data Center
The widespread use of digital electronic computing for engineering and scientific purpose began with the advent of the mainframe in the 1950s. These early systems had huge, complex hardware challenges and needed a cold, dry and secure operating environment. The multiple interconnecting devices and extensive cabling required elevated floors and many precious square metres of prime real estate to house these rooms. The operation of a single mainframe computer used colossal amounts of power and cooling.
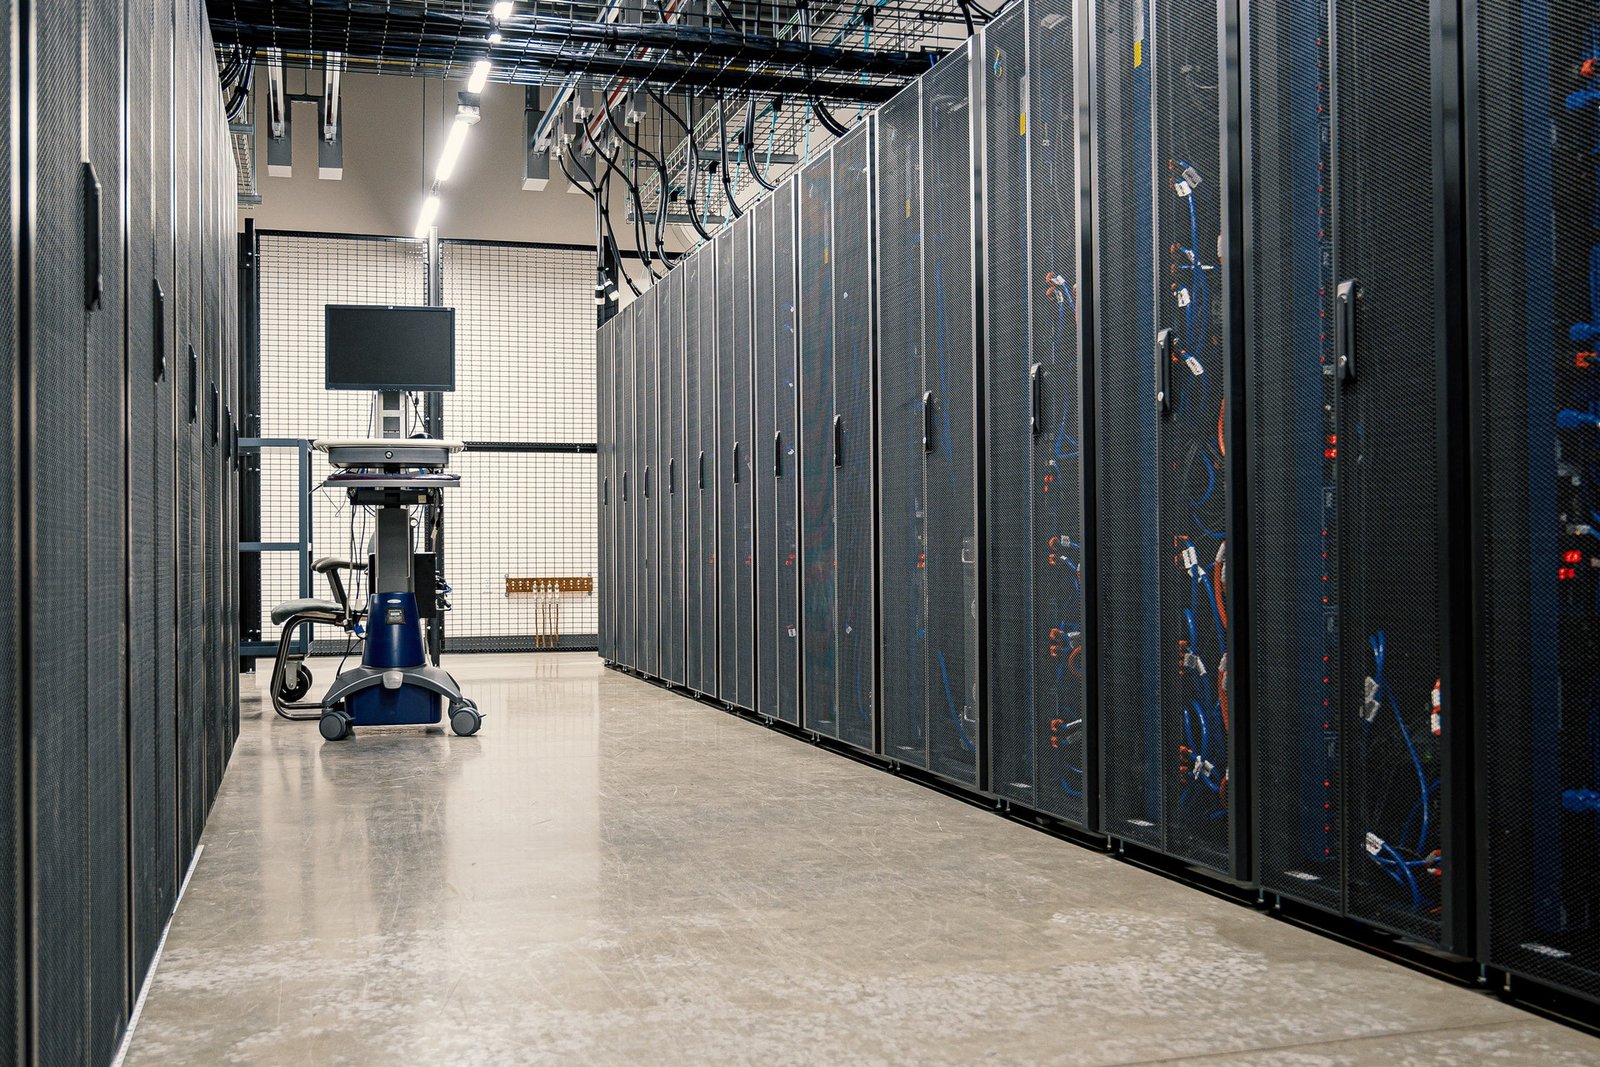
What is a Modern Data Centre? Photo by Brett Sales from Pexels
Starting in the late 1980s an explosion of general purpose computers has enabled digital transformation of businesses. Dedicated mainframe computer facilities evolved and extended their footprint to accommodate racks of general purpose server hardware. New data centres have continued to evolve and optimise efficiency. Due to the enormous cost of building and refurbishing data centres there is a continuum of capability and efficiency. Data centres are energy-hungry buildings: a small one may draw 10MW of power and a large one can draw 100MW or more.
Computer Room Air Conditioning (CRAC) Hot & Cold Aisle Cooling
Ceiling / Hot Air Plenum
▼
▼
❄
CRAC Unit Cools & recirculates air
▼
▼
Cold Aisle Cold air rises
▲
▲
▼
▼
❄
CRAC Unit Cools & recirculates air
▼
▼
Raised Floor / Cold Air Plenum
The operation of server CPU, GPU, disk and PSU all generate heat proportional to the amount of power they draw. Cooling servers can consume vast amounts of energy. Data centre computer halls use air conditioning systems to cool the room. A common computer room design is to control airflow and cooling using a concept of hot and cold aisle cooling. Managing cooling efficiently is complex, to compensate many traditional data centres are overcooled.
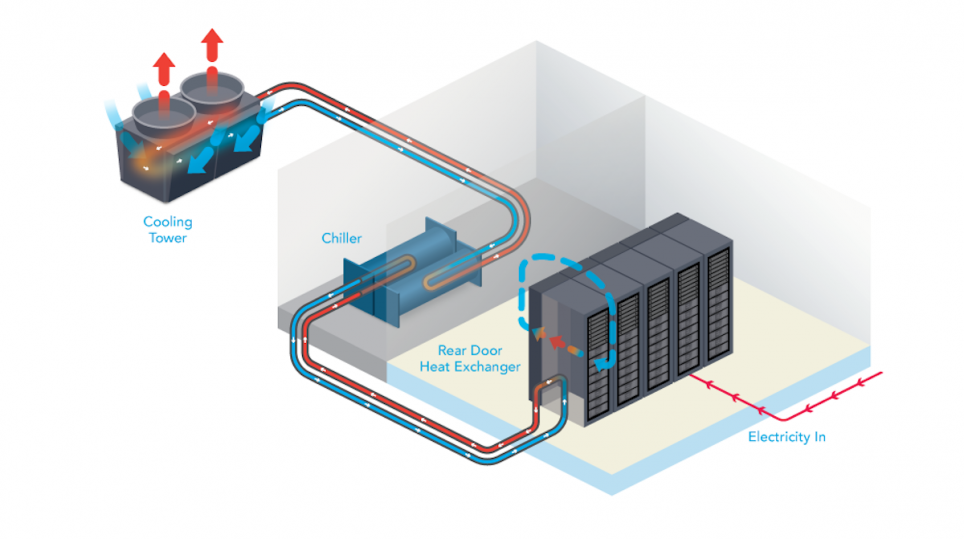
Liquid Cooled Racks
Water has between 50 and 1,000 times the capacity to remove heat. Targeted liquid cooling enables greater server density and significantly reduces in the amount of energy required for cooling. The use of liquid cooled racks increases rack the maximum power draw capability from 15kW to 45kW.
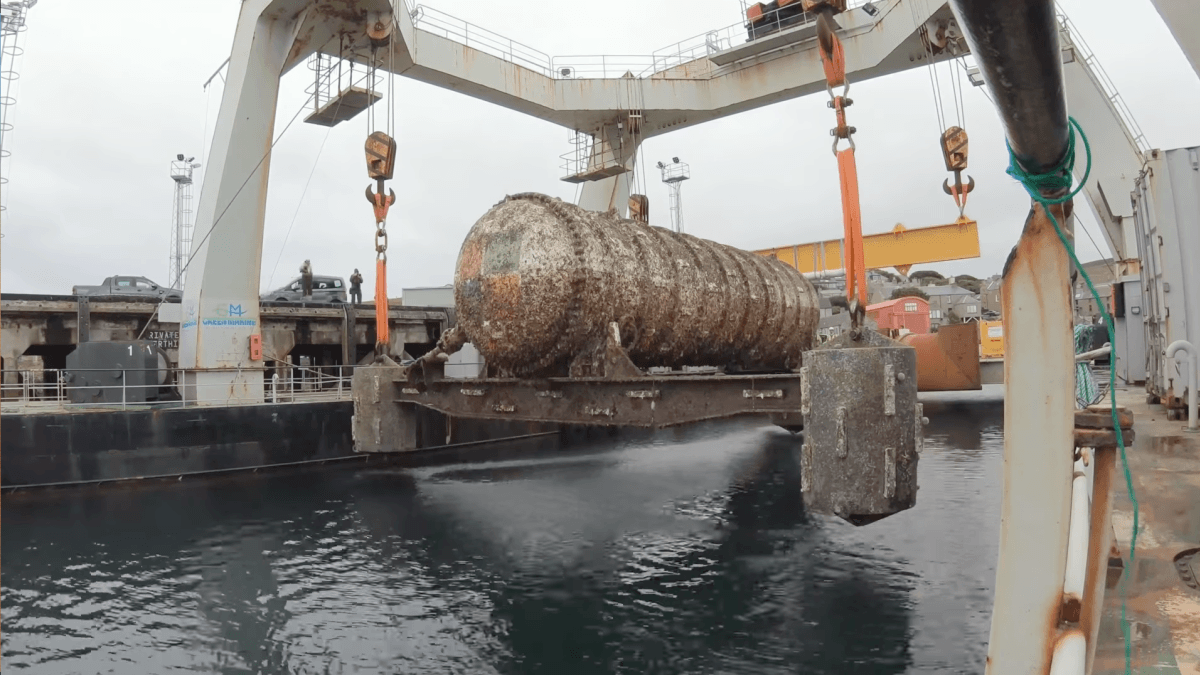
Data Centres & Nature for Cooling
As computer networking technology has improved this has allowed innovation in data centre location. Hosting servers in a cold country with supplies of sustainable energy such as Iceland. Microsoft has also been experimenting in underwater data centres to reduce burden of cooling.
Power Usage Effectiveness (PUE) Data Centre Total Power
Power Systems
Uninterruptible Power Supplies Power Distribution Units Battery Backup Cooling
Computer Room Air Conditioning Chillers IT Systems
Servers Storage Systems Network Switches Network Routers Firewalls Telco Equipment PUE = Total ÷ IT Systems
Lower is better (1.0 = ideal)
DCiE = (1 ÷ PUE) × 100
Higher % is better
Operational Overhead
Efficient data centres minimise this overhead
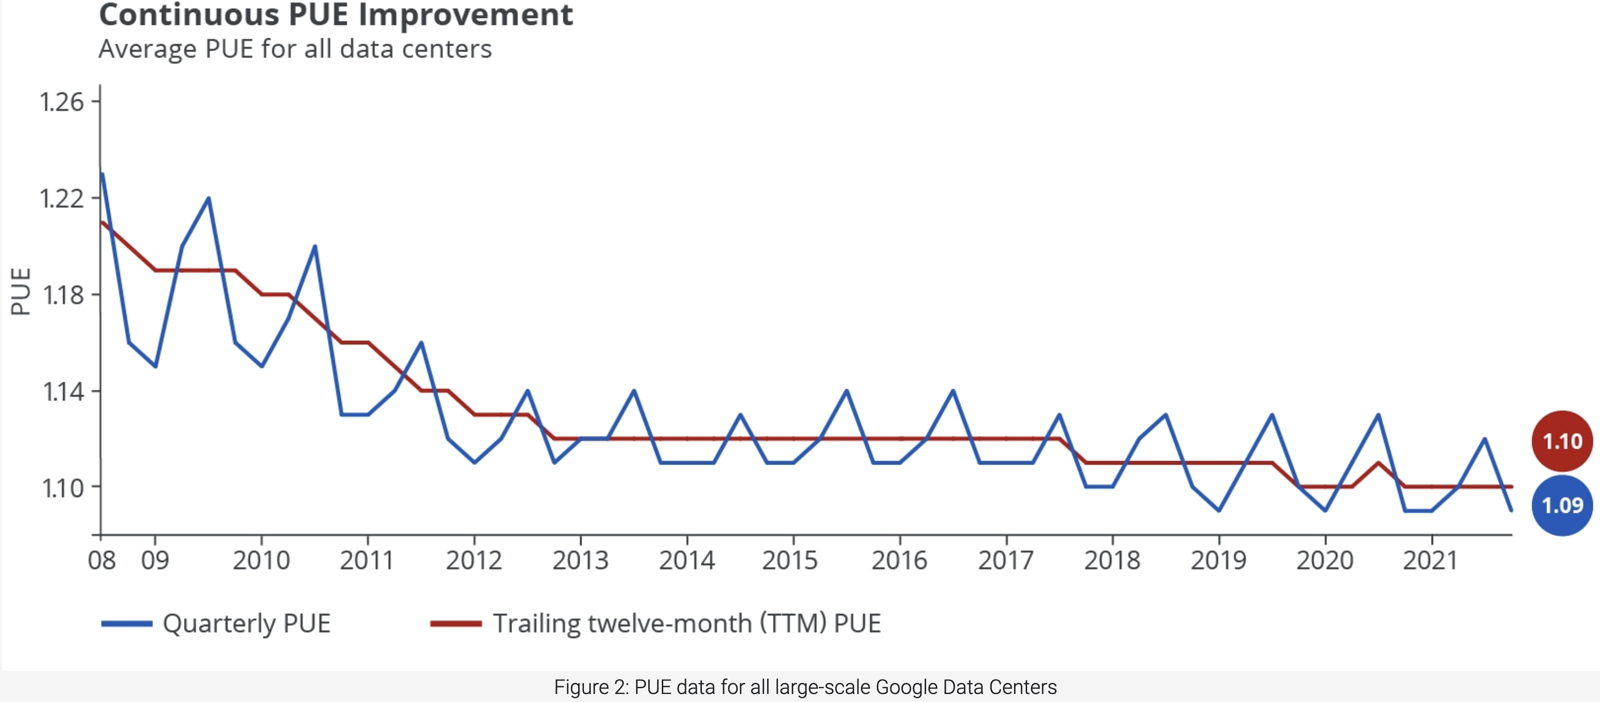
google.com/about/datacenters/efficiency
As we've found there are many factors which effect the energy efficiency of a data centre. Power Usage Effectiveness was introduced in 2007 as a standardised way of measuring and compare date centre power efficiency. It is a calculation of efficiency based on the overhead of cooling and the power systems. DCiE, Data Center Infrastructure Efficiency is another term commonly seen this is just expression of PUE as a percentage.
Key Takeaway 1 Greenhouse gas emissions can be reduced by migrating existing workloads to hosting facilities with lower PUE .
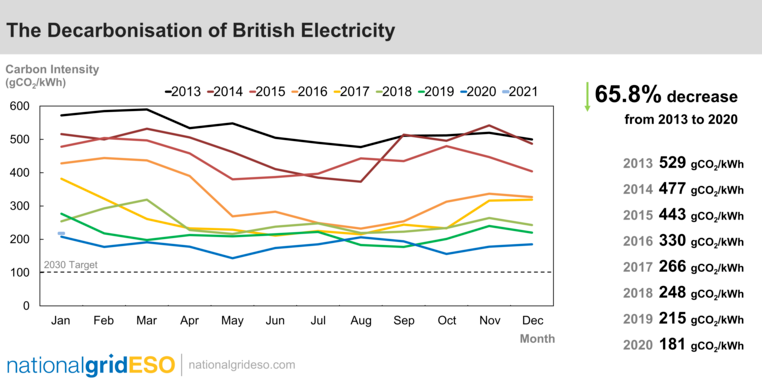
Grid Carbon Intensity (gCO₂eq/kWh) nationalgrideso.com/carbon-intensity
The carbon intensity of electricity is the number of grams of carbon dioxide (CO2) it takes to make one unit of electricity at one kilowatt per hour (kW/hour). Electricity that's generated using fossil fuels is more carbon intensive, as the process by which it's generated creates CO2 emissions. Renewable energy sources, such as wind, hydro or solar power, produce next to no CO2 emissions, so their carbon intensity value is much lower and often zero. Most countries are looking to decarbonise their electricity grids. Progress towards these goals varies greatly between countries and regions within countries. The energy grid the data centre draws power from has a large impact on green house gas emissions of the hosted workload.
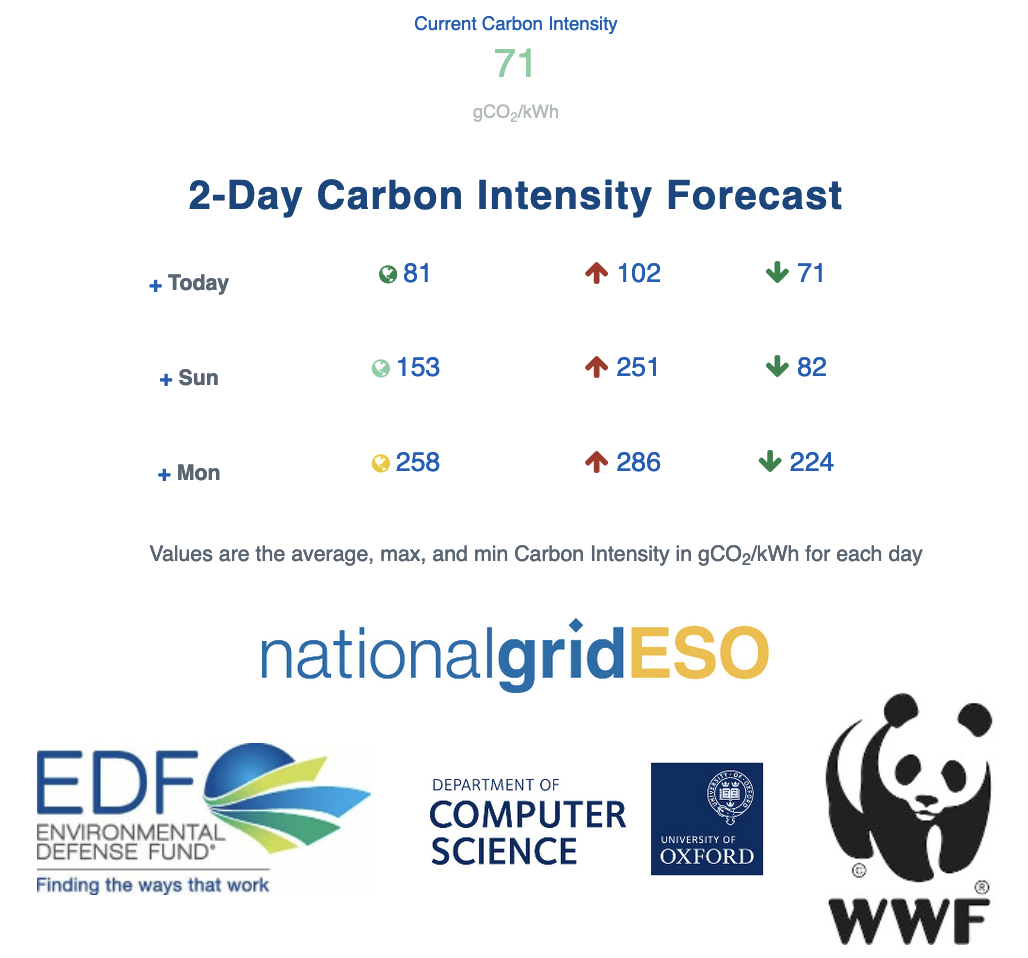
Grid Carbon Intensity Forecasting carbonintensity.org.uk
Renewables produce variable amounts of energy so grid carbon intensity values are dynamic. Machine learning can be used by grid operators used to produce carbon intensity forecasts. National Grid, in partnership with with the Environment Defence Fund, University of Oxford Department of Computer Science and the WWF, have developed the worlds first Carbon Intensity forecast with a regional breakdown.
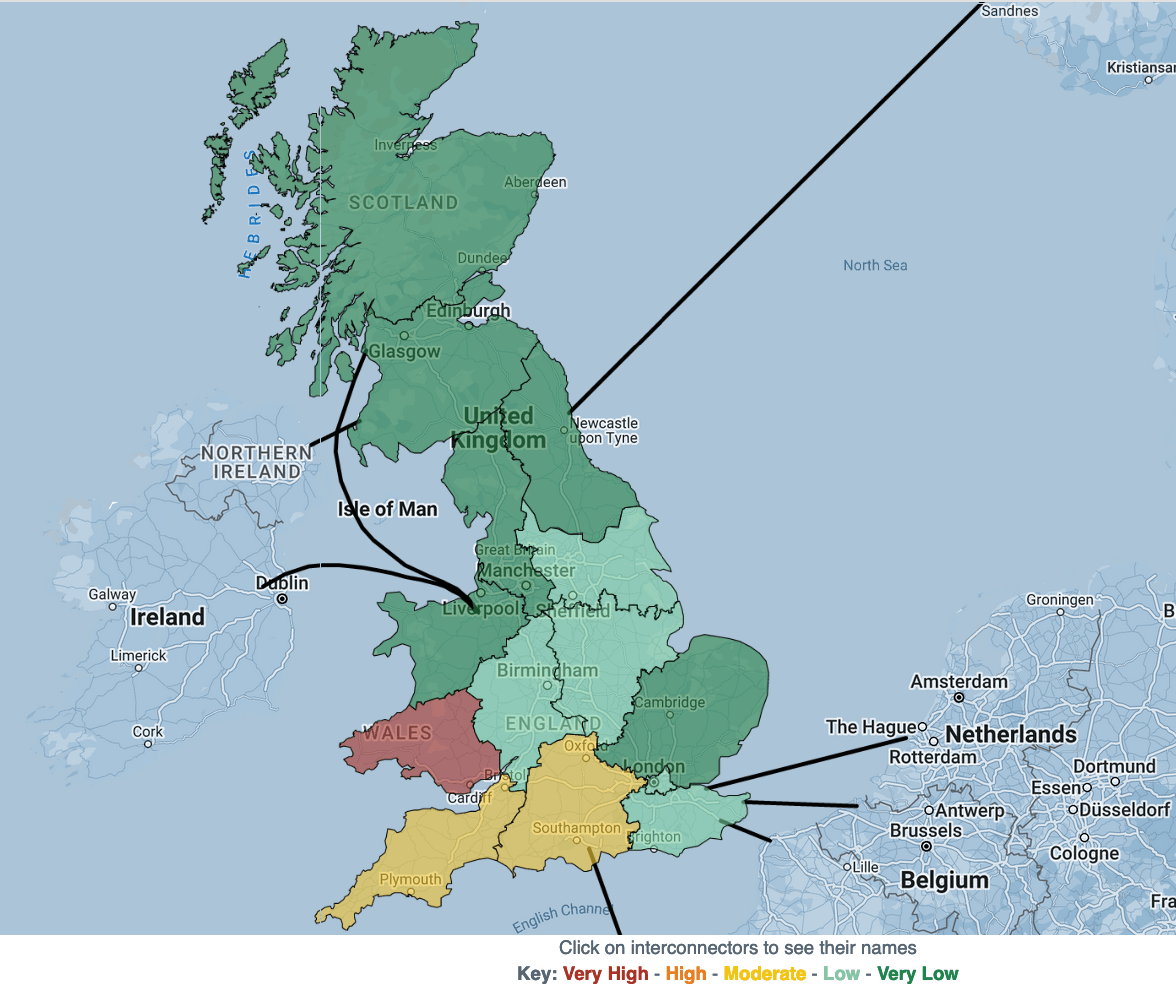
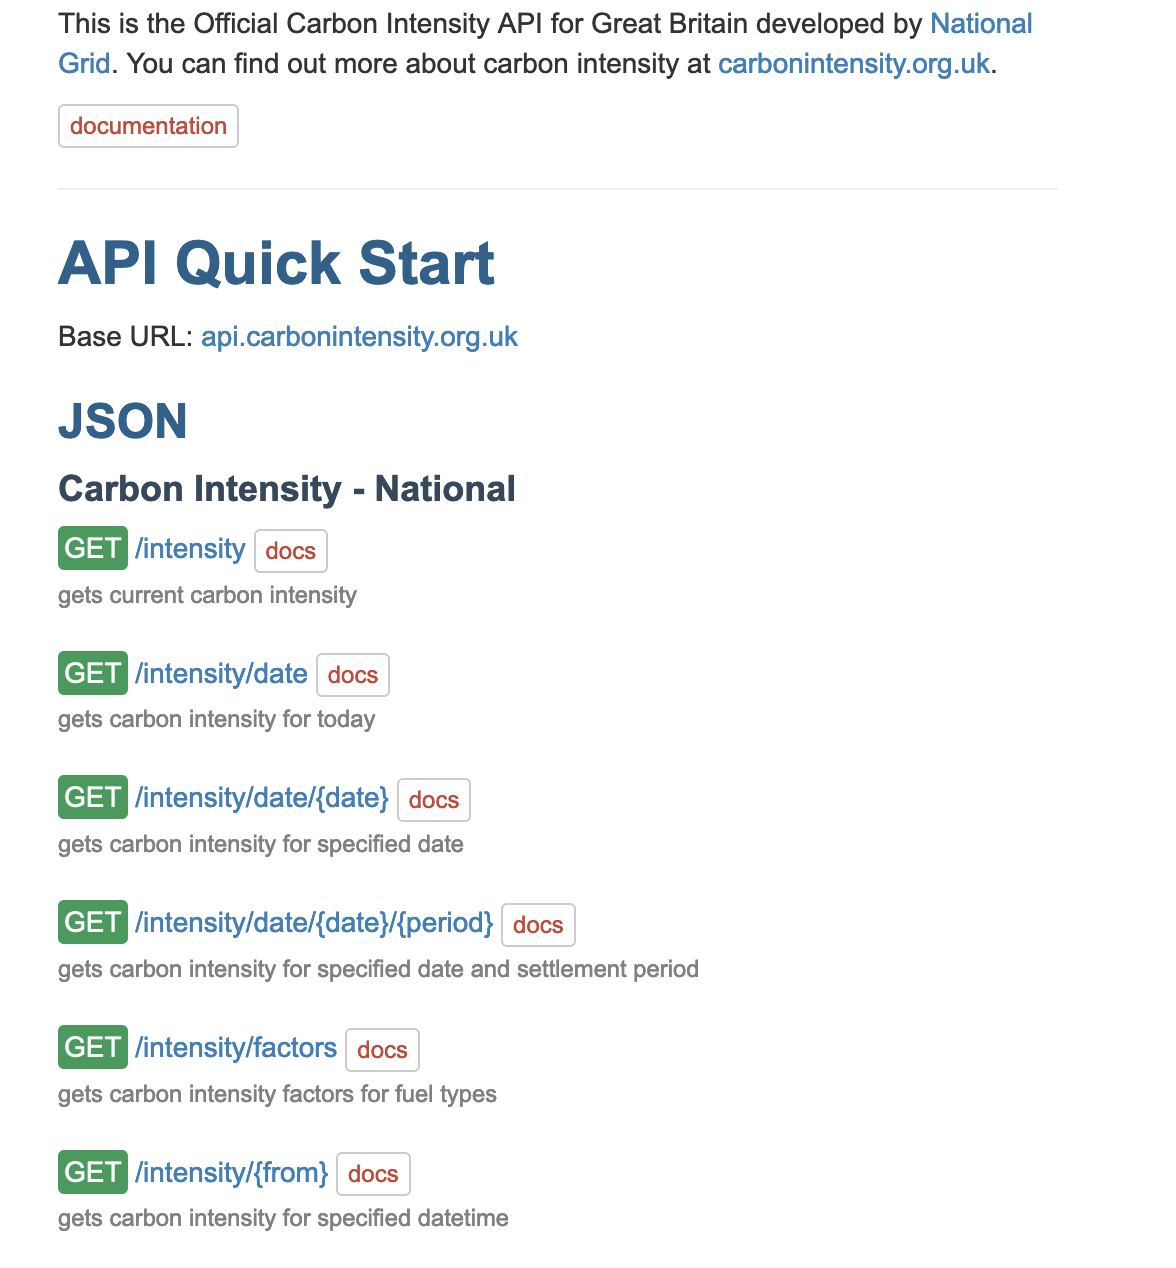
National Grid Carbon Intensity API api.carbonintensity.org.uk
National Grid make the carbon intensity and carbon intensity data available accessible via their website, programmatically via a public API.
Cloud Regional Carbon Free Energy Region Location CFE% Grid gCO2 /kWh Low CO2 europe-north1 Finland 94% 133 ✓ us-central1 Iowa 93% 454 ✓ us-west1 Oregon 90% 78 ✓ southamerica-east1 Sao Paulo 88% 103 ✓ europe-west1 Belgium 79% 212 ✓ europe-west6 Zurich * 87 ✓ northamerica-northeast1 Montreal * 27 ✓ europe-west3 Frankfurt 63% 293 europe-west4 Netherlands 60% 410 europe-west2 London 59% 231 us-east4 N. Virginia 58% 361 us-west2 Los Angeles 54% 253 asia-northeast3 Seoul 31% 457 us-west3 Salt Lake City 28% 533 us-east1 S. Carolina 27% 480 us-west4 Las Vegas 19% 455 asia-east1 Taiwan 18% 540 asia-northeast1 Tokyo 12% 554 asia-south1 Mumbai 12% 721 australia-southeast1 Sydney 11% 727 asia-southeast1 Singapore 4% 493 australia-southeast2 Melbourne * 691 asia-south2 Delhi * 657 asia-southeast2 Jakarta * 647 europe-central2 Warsaw * 622 asia-east2 Hong Kong * 453 asia-northeast2 Osaka * 442
* Data not publicly available | All regions report 0 net operational GHG emissions (carbon offsets applied)
cloud.google.com/sustainability/region-carbon
Public clouds have data centres in multiple regions each draws electricity from the grid where the region is located. The regional grids can generates more or less carbon emissions depending on the type of power plants generating electricity for that grid and when it is being consumed. In 2020, Google set a goal to match their energy consumption with carbon-free energy (CFE), every hour and in every region by 2030. To characterize each region they use a metric: "CFE%". This metric is calculated for every hour in every region and tells us what percentage of the energy we consumed during an hour that is carbon-free. Google Cloud makes this data publicly available as a BigQuery data set.
Computing's Unique Advantage Significant spatial, temporal, and performance flexibility Software-based fault-tolerance (checkpointing, replication) Global footprint encompassing thousands of clouds and edge sites Computing is well-positioned to adapt to unreliable clean energy
The computer software industry has a unique advantage over many other industries. Software engineering can offer significant scope around spacial, temporal and performance characteristics which can allow for flexibility in scheduling. Software can be engineered to be fault-tolerant and accommodate failure domains entire energy grids. The options for modern software workload hosting can also now be globally distributed across multiple clouds, content delivery network points of presence and edge compute.
Key Takeaway 2 Grid carbon intensity forecasting and carbon free energy matching can be used to schedule workload to run during windows with the lowest carbon impact .
CarbonFirst carbonfirst.org
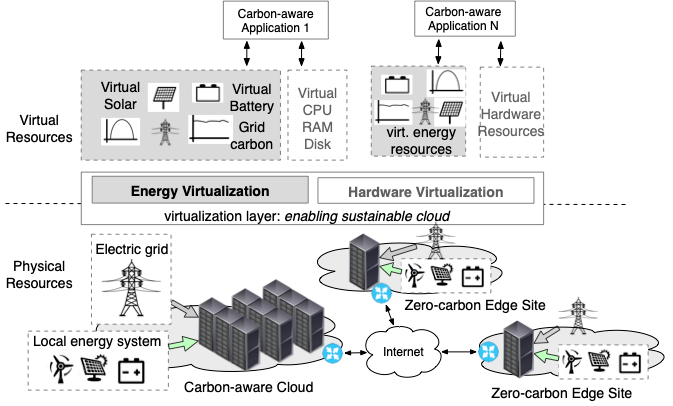
Professors and post doctoral researchers at Massachusetts Amherst and California Institute of Technology are working on a project called CarbonFirst. The project's foundation focuses on developing a software-defined energy virtualization layer that provides applications visibility into, and control of, their own energy and carbon usage. The project is supported by the National Science Foundation and VMware.
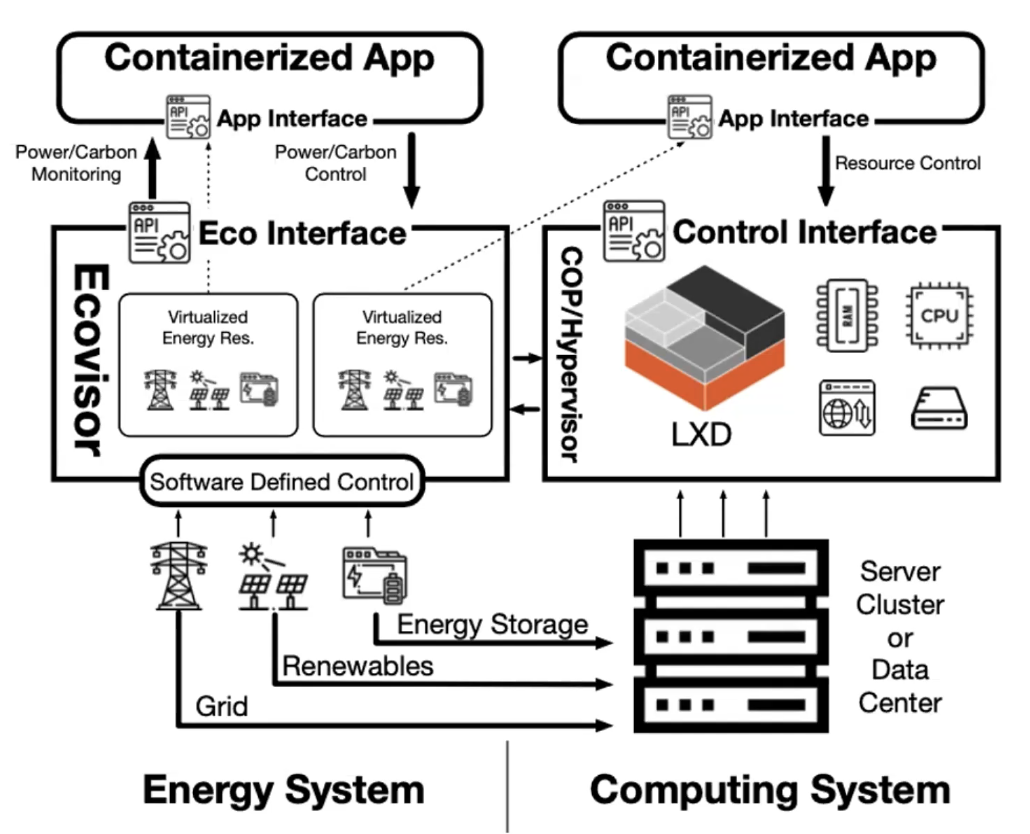
Ecovisor
The goal is to provide a software-defined control of a virtual energy system which provides an intelligent abstraction. It is akin to a hypervisor but virtualises the energy system instead of server hardware. It takes feed from energy system metrics and exposes these via an API to the virtual clusters. This would allow enablement of workload policies to determine the applications share of grid power, solar and battery capacity.
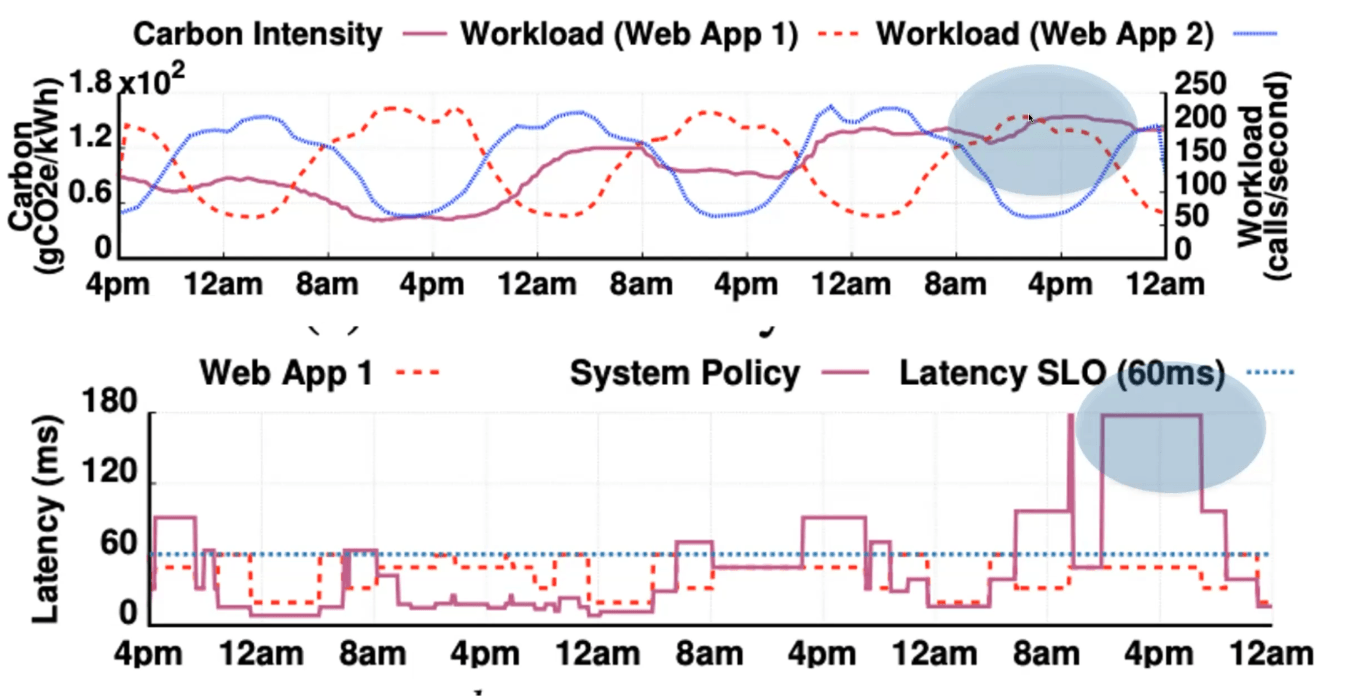
Application Aware Carbon Budgeting
A realtime feed of the energy metrics via the ecovisor would enable application specific carbon budgeting to be considered in workload scheduling as opposed to system level carbon-rate limiting. Allowing the application to be engineered to be aware and work within a carbon budget offers potentially much more predictable application performance.
Key Takeaway 3 Make forward-looking software engineering designs which can accommodate upcoming carbon awareness innovations .
Midrange Server Evolution 1998 2006 2022 2025 Model Compaq Proliant 6500 HPE C7000 BL460c G1 HPE C7000 BL460c G10+ HPE Synergy 480 Gen11 Config 5x 7U servers 4x 10U chassis, 64 blades 4x 10U chassis, 48 blades 4x 10U frames, 48 blades CPU/server 2GHz (4x 500MHz) 13.3GHz (4-core 3.33GHz) 124GHz (40-core 3.1GHz) 276GHz (2x 60-core 2.3GHz) RAM/server 4GB 48GB 4TB 8TB DDR5 CPU/rack 10GHz 852GHz 5,960GHz 13,248GHz RAM/rack 20GB 3TB 192TB 384TB Power/rack 2.5kW 28.8kW 28.8kW 32kW Efficiency 4 GHz/kW 29.6 GHz/kW 207 GHz/kW 414 GHz/kW
100x improvement in compute per watt over 27 years
Through the 1980s and 90s computer usage within all businesses grew massively. Initially these general purpose computers had tower form-factor and were placed on the floor of the old mainframe computer rooms. With structured data centre facilities came standardised rack hosting of servers. Server hardware has evolved continually since with each generation of hardware bringing improved CPU performance and power efficiency.
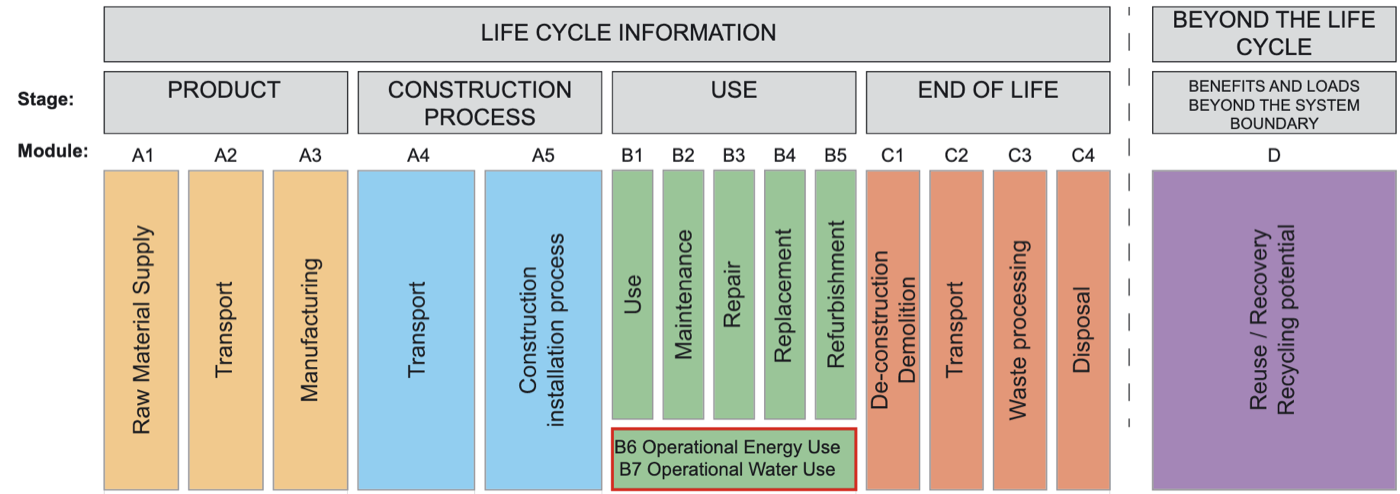
Operational vs Embodied Carbon istructe.org
Servers are typically build from metals and silicon. The embodied carbon impact of infrastructure lifecycle also needs to be considered.
Optimised Hardware Refresh Cycles How often does your organization typically refresh servers?
5 years became most common in 2020
3 years was most common in 2015
Source: Uptime Institute Global Survey of IT and Data Center Managers
With CPU core speed remaining flat, improvements in IT require more multi-core processors and, consequently, more power consumption per operation. The case for frequent hardware refreshes to improve performance has diminished. The most common period for a hardware refresh in 2015 was three years; in 2020, it had extended to five years. Increase hardware refresh cycle interval directly decreases embodied carbon impact.
Key Takeaway 4 Technological advances enable more processing at same or lower power. Extending hardware refresh cycles increases embodied carbon efficiency .
Performance to Power Ratio Most server components have high baseline power; only CPU scales significantly with workload
Active Workload Power (W) Efficiency Idle 2,000 0% useful work 10% 2,200 10% more power 20% 2,400 20% more power 30% 2,600 30% more power 40% 2,800 40% more power 50% 3,000 50% more power 60% 3,200 60% more power 70% 3,400 70% more power 80% 3,600 80% more power 90% 3,800 90% more power 100% 4,000 100% more power
Example: HPE Blade Chassis
Server Blade Components
CPU Most variable
Memory High baseline
SSD/Storage High baseline
NICs High baseline
Chassis Shared
■ Most variable■ High baseline
Many server components constantly draw power, disk, network, memory, fans, the effect is with no active workloads the chassis draws ~2,000watts. When the server chassis is powered on with no workload, in Active Idle state it is consuming 2kW. The CPU has a variable power draw, each 10% workload increment draws additional ~200watts. Highly loaded servers are more power efficient.
Increasing Workload Density With Virtualisation
Facility power assumes PUE of 1.5
VMware/IDC Whitepaper 2020
Virtualization of workload increases density which increases power efficiency. Since early 2000's VMware ESX has enabled the consolidation of multiple servers onto fewer physical devices.
Key Takeaway 5 Server virtualisation is an easy way to increase workload density and energy efficiency without refactoring application architecture .
Workload Demand Optimisation CPU
Oversized VMs
RAM
Oversized VMs
Storage
Oversized VMs
However with the advent of server virtualisation came the dawn of workload sprawl. With the ease of provisioning it is easy for large estates become inefficient. Implement continuous monitoring and continuous improvement day two operations programs. Modern virtual machine monitoring tooling typically has capabilities to continuous monitoring and report on workload inefficiency.
Key Takeaway 6 Implement continuous monitoring and day-two operations programs to identify and eliminate waste.
Workload Availability Optimisation Two node cluster 50% unused overhead Five node cluster 20% unused overhead Ten node cluster 10% unused overhead
Typically clusters are designed to provide high ability with resources to restart workload in event of host failure. A common security design pattern was to have network security zones with boundary aligned to the cluster boundary. The design pattern of network placement aligned to cluster placement led to a high number of small server clusters. Small clusters designed for workload availability have a higher percentage of resources unused.
Key Takeaway 7 Refactor architecture towards larger, more efficient clusters .
Workload Isolation Architectures Reducing duplication and complexity →
Virtual Machines Kernel duplication
Unikernels App Kernel
App Kernel
App Kernel
Just enough kernel
To behave consistently applications require isolation from other applications. With virtual servers isolation is achieved by each running an OS and single application service instance. With containers a single guest kernel can service multiple isolated application service instance. Ease of isolation of parts of a system allows applications to be more atomic micro-services. Sharing OS kernel reduces resource requirement for each application.
Event Driven Scale to Zero Knative Serving
no requests
Idle Zero energy
↓ request
Cold Start Scale 0 → 1
↓↓↓ load
Under Load Scale 1 → N
no requests
Idle Zero energy
Compute resources consumed only when processing requests
Kubernetes is designed to keep multiple copies of containers running and can react to auto-scale. In the scale-to-zero model, the containers are only started when required. A piece of software is inserted between inbound requests and the container.
Key Takeaway 8 Refactoring towards containerised architectures unlocks per-workload energy efficiency . Scale-to-zero orchestration further eliminates waste.
RISC vs CISC: Performance per Watt ARM (RISC) delivers significantly better energy efficiency across workloads
RISC (Reduced Instruction Set)
Simpler instructions Lower power per operation More cores per watt CISC (Complex Instruction Set)
Complex instructions Higher power draw Legacy compatibility amperecomputing.com
AArch64 Linux has matured very well it is as easy to adopt as x86_64. Delivers better performance levels while consuming lower power. 2x improved performance per watt across various workloads.
Key Takeaway 9 Refactoring from complex to reduced instruction set architectures (ARM) can unlock massive per-workload energy efficiency .
Thank You Darryl Cauldwell